
Embedded Linux Debugging Made Easier
August 04, 2021
Blog
Debugging embedded Linux is highly complex, presenting even the most experienced of embedded systems developers with many challenges. But visual trace diagnostics tools that specifically support embedded Linux can make the job considerably easier.
Recently, I was tasked to develop a custom Linux driver to consume data streamed by an external device. While there are mechanisms native to the Linux kernel to ensure that the functionality of the driver is correct, debugging and evaluating performance is far from straightforward. That’s why I decided to test if and how new trace tools such as Tracealyzer with support for embedded Linux would help me, from analyzing the driver and interrupt handler, to examining the userspace applications and compiler options.
I used the trace tool with a Yocto-based Linux distribution, starting with building a custom layer on a board support package to enable the use of the open source LTTng library. This provided numerous valuable perspectives of the execution of the driver as part of the Linux system, including the kernel. It also gave me a more holistic view of the driver to make sure there are no performance bottlenecks or identify the cause of any bottlenecks.
A diagnostic trace tool can also help uncover performance issues in the IRQ handler without having to use the dreaded printk statement. In my case, it uncovered a need to acknowledge the device interrupt over the I2C bus to prevent thrashing. Without using a trace tool, this hidden bug would not have been spotted or manifested itself until shortly before release when the extraneous printk calls were removed. The tool also uncovered the severe impact of including a printk in an interrupt handler. Use of a trace tool effectively avoided the need for driver modifications at a late stage, which would have incurred significant delays and costs.
Using a trace tool, I was also able to test my hypothesis about how setting the CPU affinity of a process would impact its performance. Analyzing the interactions between the different execution elements under normal and strenuous conditions showed the best effort algorithm of the Linux kernel. This identified certain areas of the Linux kernel scheduler and the iperf codebase for further investigation.
Trace tools can be even more powerful when evaluating the userspace performance. Like most embedded software developers, I develop userspace applications targeting a Linux system. Combining the trace tool’s output with LTTng tracepoints provides an invaluable way to help me determine how well my application is performing, to identify any anomalous behavior, and to provide high level timing statistics. I can then use the tool to further troubleshoot any timing issues and improve performance of the application.
I also found the combination of a trace tool and the LTTng library very powerful in helping me quickly understand the impact of certain compiler options on the performance of userspace applications that perform floating-point calculations. Usually, this sort of analysis is done after the fact, when the application is completed but the application is underperforming, and can take a lot of time. Using the tool during development to verify software timing helped me avoid the hit on performance.
All in all, I found that trace tools such as Tracealyzer can be a powerful element to find hidden bugs and optimize the performance of embedded Linux systems.
Features such as high-level overviews for top-down exploratory analysis, including process interactions, process forking, CPU usage, RAM usage, I/O usage, file usage, state machines and user-defined metrics provide invaluable and intuitive trace views for showing the details, scalable up to large Linux traces with respect to both responsiveness and clarity. When adapted to specific use cases via customizable event interpretation, any user-defined data sets such as Intervals and state machines can be displayed in highly configurable views. Lastly, use of the open source LTTng library opens a wide range of capabilities to explore various aspects of an embedded Linux design, from the driver and interrupt handler to the userspace applications and compiler options. Using such a combination during the development process not only gives more visibility but addresses problems earlier in the process. From my viewpoint of a highly experienced developer, this avoids hidden bugs and saves time and cost later in the project.
Supporting images

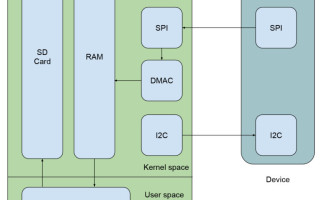
Figure1. Use of the open source LTTng library in combination with a trace tool can shine light on performance issues when evaluating a custom Linux kernel (pictured).

Figure 2: This vertical trace view displays the stream of events using a vertical timeline. It starts at the top and time grows downwards. Each column represents a single execution context in the system – usually a task or an interrupt handler – and rectangles within a column show when a particular task was running. Horizontal labels (left) mark recorded software events. The graph is completely responsive so that zooming in reveals more details.
Mohammed Billoo is Founder of MAB Labs, LLC. He has over 12 years of experience architecting, designing, implementing, and testing embedded software, with a core focus on embedded Linux. This includes custom board bring-up, writing custom device drivers, and writing application code. Mohammed also contributes to the Linux kernel and is an active participant in numerous open-source efforts.
He is also an Adjunct Professor of Electrical Engineering at The Cooper Union for the Advancement of Science and Art, where he teaches courses in Digital Logic Design, Computer Architecture, and Advanced Computer Architecture. Mohammed received both his Bachelor’s and Master’s of Electrical Engineering from the same institution.

MAB Labs founder, Mohammed Billoo, is an embedded software consultant with over 12 years of experience in embedded software across a multitude of domains, including Defense, Space, and Commercial. He is an avid blogger and contributor to the open-source community. Mohammed is also an Adjunct Professor of Electrical Engineering at The Cooper Union.


