Static analysis-enabled advanced program visualization eases the development process
May 01, 2013

Advances in static analysis and graphics technology have enabled new software visualization tools that can yield insights into the structure of comple...
It has long been evident that pictures are often better than text in helping developers understand complex programs and review code, so the use of program visualization in software development is widespread. UML and other primarily graphical formal design notations are now widely accepted as the best standard mechanisms for communicating various aspects of software design. Some model-based design tools can generate code directly from graphical representations. At the informal end of the spectrum, developers often sketch out flowcharts or call graphs to inform themselves or others of important aspects of the software.
UML diagrams are all very well for designs, but suffer from two important drawbacks when used later in the development process to help developers understand existing code. First, as design abstractions they (correctly) omit some implementation details, but those details are often important if the goal is to understand the finished software. Second, design diagrams are very often stale with respect to the implementation, leading to an inaccurate or incomplete portrayal of the system as it actually exists.
Informal visualizations tend to be ephemeral and rarely make it into the official record of documentation for the program.
Very often, the only artifact that a developer has to work with is the code itself. Unfortunately, code visualization tools have historically been subject to problems such as confusing diagrams and difficulty in scaling to large programs. However, new tools are emerging that are beginning to solve these problems. The key advantage of these tools is their ability to generate useful visualizations directly from the code itself. As such they are guaranteed to be accurate and up to date.
Program structures
Programs are made up of a large and complex web of dependences between lots of different kinds of components. A visualization that attempted to show all of these simultaneously would be too unwieldy to be useful. Indeed, there is no single ideal visualization. Instead, the most useful visualization for a particular task is the one that corresponds to the mental model used by the engineer undertaking that task. Some of the more useful program structures are the following:
Type hierarchy
Developers usually find it very useful to see the various ways in which data types can relate to each other. The standard UML class diagram represents the class hierarchy in a form that is very easy to understand, with the association and containment relations at a higher level of abstraction than the code. While this is good from a design perspective, programmers often find it more helpful to see the concrete relations between types.
Include tree
C and C++ programs often can make heavy use of the preprocessor. If done well, this can make programs easy to understand, but very often it interposes a layer that gets in the way of understanding. Undisciplined use of the preprocessor can lead to dependence tangles that cause build problems and hurt reusability potential. Consequently, being able to see which files are included where can help engineers unravel complex dependences.
Call graph
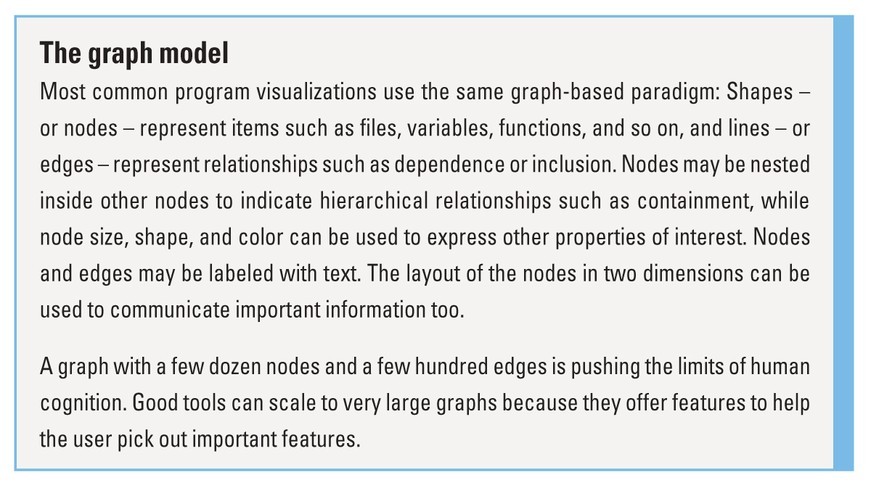
The call graph, in which each node represents a subprogram and each edge indicates one or more calls to another subprogram, is often considered the most helpful program structure to visualize. Subprograms are convenient units for developers to reason about, and the calling relation captures data and control flow nicely. A call graph for even a small program can have hundreds of nodes and thousands of edges (see Sidebar 1), so it has long been recognized that it is essentially useless to visualize the entire call graph all at once. Instead, researchers have focused on ways to visualize the call graph in smaller, easily digestible parts.
|
|
New call graph techniques and tools
Because of the importance of call graphs in program understanding and the challenges involved in visualizing them, they have been the subject of much research. In particular, new techniques have been developed to help tame call graph complexity. This section describes some of the mechanisms that have been implemented in static analysis tools delivering advanced visualization capabilities.
Top-down views
A top-down view of a call graph helps answer user questions such as “What are the high-level components of this program, and what are their properties and relationships?”
To solve this problem in the context of program understanding, tool designers take inspiration from geographic mapping programs such as Google Maps. As the user zooms in, more detail starts to resolve: first cities, then towns, villages, and ultimately, individual buildings. The level of detail shown is coupled to the zoom level.
Programs are made up of components that are themselves made up of smaller components, and so on, forming a hierarchy; although the direct calling relationship is between low-level subprograms, it can be projected up to higher-level components that contain those subprograms. In the top-down view of a call graph, the highest level items are directories. These can contain some combination of subdirectories and files, and the files will then contain subprograms. Thus, an edge from one box to another simply indicates that a subprogram contained in the first box calls a subprogram contained in the second.
This approach turns out to be very effective at helping developers gain a deeper understanding of a program.
In the left window, the user has selected the edge from component find to component gnulib. The function calls summarized by this aggregate edge are shown in the pane to the right. The right window illustrates that more detail is shown when the user zooms in to see a single function. This zoom level further illustrates an important feature: It is important for the developer to be able to relate the view to the code itself. Consequently, selecting one of those functions causes the source code of that function to be shown.
Bottom-up views
Often a developer will want to take a bottom-up approach. This helps users answer questions such as “What does this procedure do, how does it fit into the structure of the program, and how is it invoked?”
For example, say a program has crashed in a particular function. To find the cause of the crash and to plan a fix, the developer is likely to begin by focusing on that single function, then explore its immediate neighborhood to see what other functions it calls and is called by. Previously done manually on a whiteboard, a tool can handle the drudgery of drawing and layout automatically.
Metrics layers
The utility of a visualization can be increased by adding layers to show the value of various metrics. An example is shown in Figure 1. This shows a particularly useful visualization – the treemap. In a treemap, the area of a node is proportional to a metric – usually a metric that encodes the size of the item. Subnodes are then tiled inside the top level node. Edges are usually not displayed. In this example, the color intensity of each item encodes the number of code vulnerability warnings issued by the static analysis tool.
|
|

From this view, it is easy to pick out the components of the program that are the most risky. Treemaps are very effective for showing deeply nested structure, and are also very amenable to the zooming paradigm discussed earlier, where more detail is shown at higher magnifications.
These visualizations are most useful when developers use them interactively to pan around and zoom in and out, or even add and remove nodes and edges. Interacting with such an interface can be extremely frustrating if it is not sufficiently responsive. Showing hundreds of nodes and thousands of edges can be a challenge.
GrammaTech, Inc. www.grammatech.com
Follow: Twitter Facebook Blog Google+ LinkedIn YouTube