JMeter: A preferred tool for performance testing
July 06, 2017
Product

Performance testing is a non-functional testing technique to determine the system parameters in terms of responsiveness and stability under various workload. Performance testing measures the...
Performance testing is a non-functional testing technique to determine the system parameters in terms of responsiveness and stability under various workload. Performance testing measures the quality attributes of the system, such as scalability, reliability, and resource usage. The performance testing helps the product owner to identify benchmarks of the product solution. The goal of performance testing is not only the finding bugs in the code but also to find out the bottlenecks. In performance testing, a quality engineer simulates real user scenarios using any of the tools available for performance testing.
Apache JMeter is an open source Java desktop application designed to perform load tests and check functional behavior of web applications. A quality engineer can use JMeter to analyze and measure the response time of web application or variety of services (including Rest APIs). It can be used to simulate a heavy load on a server, network, or object to test its strength or to analyze overall performance under different load types. JMeter is compatible with JDK 5 or higher.
Additionally, JMeter helps with regression testing your application by letting you create test scripts with assertions to validate that your application is returning the results you expect. For maximum flexibility, JMeter lets you create these assertions using regular expressions. Note that JMeter is not a browser – it works at the protocol level.
Protocols supported by JMeter include:
- HTTP, HTTPS sites
- Web Services
- Database via JDBC drivers
- Directory – LDAP
- JMS
- SMTP
- FTP Services
JMeter features:
- It has a simple and user-friendly GUI.
- It is platform independent. On Windows, testing on JMeter can be initiated using the JMeter.bat file, and on Unix/Linux, by clicking on JMeter Shell Scripts.
- It creates and stores its test plan in XML format. That indicates that we can generate or create a test plan using a text editor.
- It is a multi-threading framework that is used for concurrent sampling using multiple threads.
- It is helpful in automated functional testing.
How does it work?
JMeter simulates a group of users sending requests to a target server and returns statistics that show the performance/functionality of the target server/application via tables, graphs, etc. (Figures 1, 3-5).

[Figure 1 | JMeter simulation]
To use JMeter, one must define the test plan, meaning one must specify:
- http or other URL to hit or SQL queries to run
- how to store/display the results
- how many threads to run to create desired load/stress
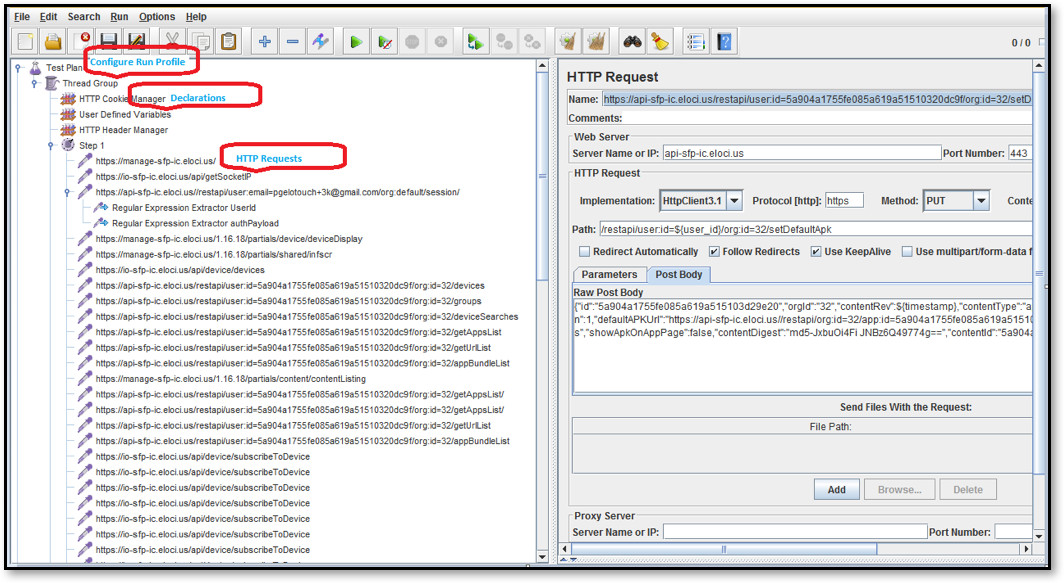
In JMeter terms, these are called threads, samplers, listeners, etc. A complete test plan contains all of these. To create it, right click on “Test Plan” on the left-hand pane of JMeter GUI and add required elements (Figure 2).

[Figure 2 | JMeter's test elements]
How does Apache JMeter simulate multiple users?
Let us take a view at how a request for web page is sent to the web server from a user’s browser and how a web page is finally displayed. Understanding this work flow will give us opportunity to imagine how JMeter fits in this work flow and how it can do same thing as a browser does.
- Step 1: The user takes actions in browser, i.e. types a site address, clicks a link, or fills form and presses submit.
In JMeter, this is not required. - Step 2: The browser creates a request in HTTP format and sends it to the server.
In JMeter, this becomes an HTTP request sampler. The HTTP request sampler sends the request in HTTP format. - Step 3: The web server receives the HTTP request, creates an HTML response, and sends it back HTML to the browser.
In JMeter, for the server, it is same request. - Step 4: The browser receives the HTML.
In JMeter, the HTTP request sampler receives HTML response and records it for analysis. - Step 5: The browser renders the HTML on the screen so the user can see text and colors (GUI).
JMeter does not does not render the HTML like the browser.
So, what makes one user transaction in terms of JMeter?
HTTP request sampler sends request in HTTP format. > Server receives HTTP request, creates HTML response and sends back HTML to HTTP request sampler. > HTTP request sampler receives HTML response and records it for analysis.
When we add a HTTP Request Sampler in JMeter Test plan, it stores one webpage calling and receiving sequence. We can call this as a single user transaction. As soon as we tell this to JMeter it can do the same thing n – number of times. It also does this multiple times simultaneously.
Finally, JMeter simulates multiple users by making copies of samplers and running them in separate threads.
Because JMeter is not exactly a browser, the HTTP Request Sampler makes all the received data available for further analysis. View Tree Listener is used for visualizing the received response. View Tree Listener is a good way to know what request was sent, what the response was, and the result of the transaction.
Why JMeter?
- JMeter is an open source tool and has numerous virtual users’ support.
- Scripting isn’t essential in JMeter, but tools like Loadrunner require scripting in C.
- It makes it easy to do parameterization and correlation compared to other tools.
- No additional configurations are required for the virtual user’s setup because it auto generates v-users on JVM.
- JMeter is cross-platform.
[Figure 3 | JMeter interface]
[Figure 4 | Report in tabular format]
[Figure 5 | Report in graphical format]
Conclusion
The JMeter tool is easy to use for injecting load on web application servers. Development and quality engineers can easily simulate a heavy load on a server using JMeter tool without doing extra setup for virtual users, extra efforts for scripting and can measure accurate response time in form of charts and table summary. JMeter results charts are useful locate bottlenecks and improve performance of the web server application. Quality engineers can identify the culprit RestAPI by analyzing JMeter results charts. JMeter tool is also used to perform server benchmark tests and scalabiity tests.


