Measuring code execution time on ARM Cortex-M MCUs
July 07, 2018
Blog

Measuring the actual execution time of portions of code can help you find the hot-spots in your code. This article will show how you can easily measure and display the execution time of code on live C
In many real-time applications, the CPU can spend 95% (or more) of its time in less than 5% of the code. This is the case for motor control, engine control, wireless communications and many other time sensitive applications. These embedded systems are typically written in C, and often developers are forced to hand-optimize the code, possibly reverting to assembly language, to meet tight deadlines. Measuring the actual execution time of portions of code can help you find the hot-spots in your code. This article will show how you can easily measure and display the execution time of code on live Cortex-M-based MCUs.
Measuring the execution time of code
There are many ways to measure code execution time. As an embedded engineer, I often used one or more digital outputs and an oscilloscope. You simply set one of the outputs high before you execute the code you want to monitor and bring the output low afterwards. Of course, there is a fair amount of setup work before you can do this: find one or more free outputs, make sure they are easily accessible to probe, configure the port as outputs, write code, compile, setup the scope and so on. Once you have a signal, you might need to monitor it for a while to see minimums and maximums. Digital storage scopes make this process easier, but there are other methods even easier than that.
Another way to measure execution time is to use a trace-capable debug probe. You simply run the code, look at the trace, compute the delta time (typically manually) and convert CPU cycles to microseconds. Unfortunately, the trace gives you one instance of execution, and you might have to look further down the trace capture to find the worst-case execution time. This could be a tedious process.
The Cortex-M cycle counter
The CoreSight debug port found on most Cortex-M based processors contains a 32-bit free running counter that counts CPU clock cycles. The counter is part of the Debug Watch and Trace (DWT) module and can easily be used to measure the execution time of code. The following code is all that is needed to enable and initialize this highly useful feature.
#define  ARM_CM_DEMCR      (*(uint32_t *)0xE000EDFC)

#define  ARM_CM_DWT_CTRL   (*(uint32_t *)0xE0001000)

#define  ARM_CM_DWT_CYCCNT (*(uint32_t *)0xE0001004)


if (ARM_CM_DWT_CTRL != 0) {        // See if DWT is available

    ARM_CM_DEMCR      |= 1 << 24;  // Set bit 24

    ARM_CM_DWT_CYCCNT  = 0;

    ARM_CM_DWT_CTRL   |= 1 << 0;   // Set bit 0

}
Using the DWT cycle counter to measure code execution time
You can measure and compute the execution time of a code segment by reading the value of the cycle counter before and after that segment, as shown below. Of course, this means that you have to instrument your code, but you get a very accurate value.
uint32_t  start;

uint32_t  stop;

uint32_t  delta;


start = ARM_CM_DWT_CYCCNT;

// Code to measure

stop  = ARM_CM_DWT_CYCCNT;

delta = stop – start;
Because we are using unsigned math, delta represents the actual execution time (in CPU clock cycles) of the measured code, i.e. even if stop is smaller than start.
Of course, it’s possible that interrupts occur while measuring the execution time of the code bracketed between the start and stop readings, so you will most likely have different values each time you execute this sequence. In this case, you might want to disable interrupts during the measurement to remove that artifact as shown below, but with the understanding that disabling interrupts is temporary and included only for the measurement. That being said, it might be useful to include the artifacts of interrupts as they affect your code’s deadlines.
Disable Interrupts;

start = ARM_CM_DWT_CYCCNT;

// Code to measure

stop  = ARM_CM_DWT_CYCCNT;

Enable Interrupts;

delta = stop – start;
If the code being measured contains conditional statements, loops or anything that can cause variations, then the value obtained might not represent the worst-case execution time. To correct this, you can simply add a peak detector as shown below. Of course, max needs to be declared and initialized to the smallest value (i.e. 0) before making any measurements.
start = ARM_CM_DWT_CYCCNT;

// Code to measure

stop  = ARM_CM_DWT_CYCCNT;

delta = stop – start;

if (max < delta) {

    max = delta;

}
Similarly, it might be interesting and useful to also know the minimum execution time. min simply needs to be declared and initialized to the largest possible value (i.e. 0xFFFFFFFF) prior to making any measurements. Here is the new code:
start = ARM_CM_DWT_CYCCNT;

// Code to measure

stop  = ARM_CM_DWT_CYCCNT;

delta = stop – start;

if (max < delta) {

    max = delta;

}

if (min > delta) {

    min = delta;

}
Execution time also depends on whether or not the CPU is equipped with a cache, as is the case for some Cortex-M4 processors as well as Cortex-M7. If your system uses an instruction or data cache, multiple measurements for the same section of code may be inconsistent. You might consider disabling the cache to measure worst case conditions.
In order to display the values, most debuggers allow you to display those variable values live. If that’s the case, displayed variables will need to be declared with global scope to retain their values and allow live monitoring. Also, the values unfortunately represent CPU clock cycles, and most debuggers are not sophisticated enough to scale variables for display purposes. Assuming a 16 MHz CPU clock speed, it would be far more convenient to display 70.19 microseconds than 1123 cycles. There is actually a better way to display live variables which also provides the ability to scale values so you can see them in a more readable form. I’ll explain how to do that shortly.
Elapsed time module
You can certainly add the snippets of code to your application, or you can use a simple module that I wrote (included with this paper). The ‘elapsed_time.c’ module, which appears below along with the elapsed_time.h module, consists of just 4 functions.
To use:
- Simply #include
- Call elapsed_time_init() prior to using the other functions defined in elapsed_time.c.
- Define the maximum number of elapsed time measurement structures by setting ELAPSED_TIME_MAX_SECTIONS. This corresponds to the number of different code snippets you want to wrap with the stop/start code.
- Call elapsed_time_start() and pass it the index of the code snippet you want to monitor (i.e. 0 .. ELAPSED_TIME_MAX_SECTIONS-1).
- Call elapsed_time_stop() and pass it the same index that you used in the elapsed_time_start() call.
- If your debugger allows you to monitor variables live (i.e. while the target is running), you can display the elapsed_time_tbl[] and look at the ELAPSED_TIME structure of the corresponding index you used.
- Perform steps 4 to 6 repeatedly and subject your code to its worst and best case conditions so that the .min and .max fields of the ELAPSED_TIME structure provide a good representation of the execution time of the snippet of code you are measuring.
You will notice (see elapsed_time.c) that I didn’t disable interrupts during the measurement because ISRs might be involved and you might want to know how that impacts the perceived execution time.
void  main (void)

{

    // Some code

    elapsed_time_init();         // Iitialize the module

    // Some code

}


void  MyCode (void)

{

    // Some code here

    elapsed_time_start(0);    // Start measurement of code snippet #0

    // Code being measured

    elapsed_time_stop(0);     // Stop and

    // Some other code

}
Of course, the minimum and maximum execution times depends on how often you make the measurements as well as whether or not the code is subject to its best and worse conditions, respectively.
The fields within elapsed_time_tbl[] can be displayed using Silicon Labs’ Micrium uC/Probe. In fact, uC/Probe can display every field and also scale each of the values so that it can convert CPU clock cycles to microseconds, which is much friendlier. uC/Probe doesn’t require any instrumentation of your code when interfacing to the CoreSight debug port, which is built-into most Cortex-M MCUs.
As a side note, there is no need to display the start field since it’s only used to record the value of the DWT cycle counter at the start of the measurement. However, the start field can be used to show activity. In other words, you would know that measurements are taking place when you see this value change.
Example displays using uC/Probe
I used the elapsed_time.c module in conjunction with uC/Probe and measured the execution time of four snippets of code.
Figure 1 shows the values in raw form using both IAR’s LiveWatch (left) and uC/Probe’s Tree View control (right). Note that the screenshots have been taken at different times. elapsed_time_tbl[] is an array that stores the measurements for the different code snippets.
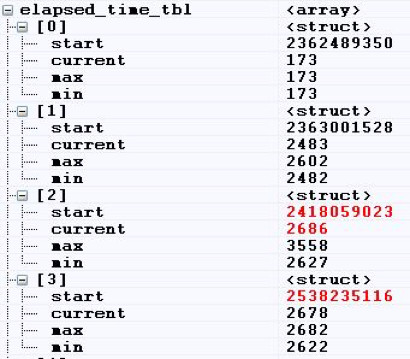
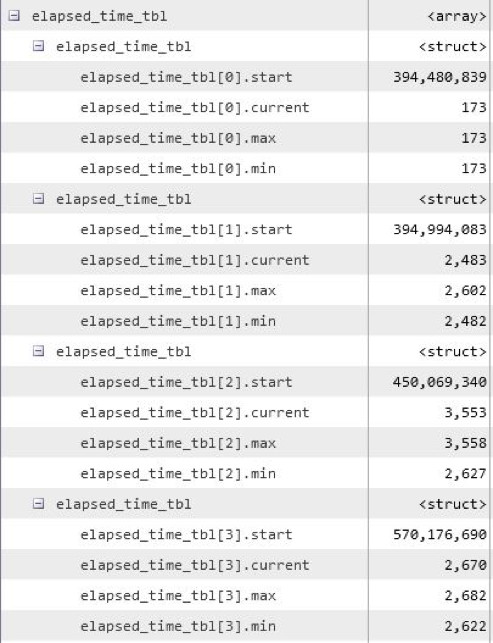
Figure 1, IAR and uC/Probe’s Tree View Control.
You can also assign the min/max/current values to gauges and numeric indicators as shown in Figure 2. Here, the values are displayed in microseconds since I applied a scaling factor of 0.0125, with the CPU running at 80 MHz. I also decided to only display the maximum execution times. The push button on the left is used to reset the statistics, thus forcing the recalculation of the min and max values.
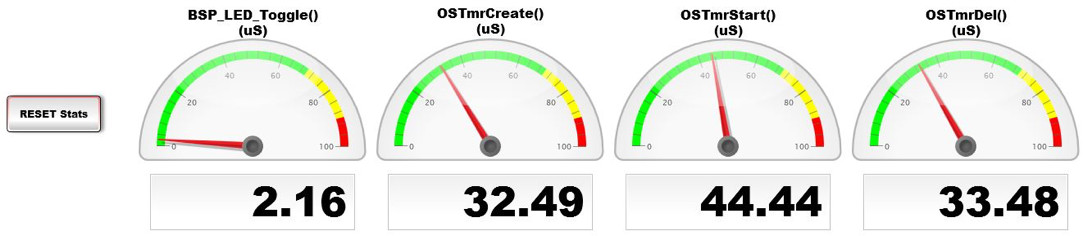
[Figure 2 | Displaying maximum execution times using one of uC/Probe’s gauges.]
One of the very powerful features of uC/Probe is the ability to interface with Microsoft’s Excel and thus display values (live) on a spreadsheet as shown in Figure 3.
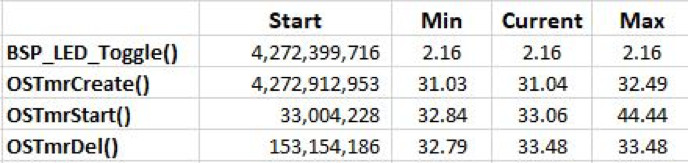
[Figure 3 | Using Excel to display live data.]
Summary
As embedded developers, we have many tools we can use to test and validate our designs. I’ve demonstrated how easily you can use just one of the numerous features of the Cortex-M processor, the DWT cycle counter.
Micrium’s uC/Probe offers a lot of functionality allowing you to monitor many variables in your application using gauges, meters, numeric indicators, the Excel interface or graphs/plots. With its built-in oscilloscope capability, you can also capture the values of up to seven additional variables once a trigger condition is met.
Feel free to use or improve the elapsed_time.* module. Don’t hesitate to send me feedback. Another feature I thought about adding was a callback function that is called when the maximum execution time exceeds a threshold. This could be useful if you wanted to be notified (turn on an LED, sound an alarm, etc.) as soon as such a condition occurs. If fact, you could even set a breakpoint in case you wanted to see what conditions caused the threshold to be exceeded.
References
- Micrium’s uC/Probe
https://www.micrium.com/ucprobe/about/ - IAR’s Embedded Workbench
https://www.iar.com/iar-embedded-workbench/ - ARM’s Cortex-M
https://www.arm.com/products/processors/cortex-m
elapsed_time.c
/* ******************************************************************************** * MODULE TO MEASURE EXECUTION TIME ******************************************************************************** */ #include#include /* ******************************************************************************** * CORTEX-M - DWT TIMER ******************************************************************************** */ #define ARM_CM_DEMCR (*(uint32_t *)0xE000EDFC) #define ARM_CM_DWT_CTRL (*(uint32_t *)0xE0001000) #define ARM_CM_DWT_CYCCNT (*(uint32_t *)0xE0001004) /* ******************************************************************************** * Data Structure ******************************************************************************** */ typedef struct elapsed_time { uint32_t start; uint32_t current; uint32_t max; uint32_t min; } ELAPSED_TIME; /* ******************************************************************************** * STORAGE FOR ELAPSED TIME MEASUREMENTS ******************************************************************************** */ static ELAPSED_TIME elapsed_time_tbl[ELAPSED_TIME_MAX_SECTIONS]; /* ******************************************************************************** * MODULE INITIALIZATION * * Note(s): Must be called before any of the other functions in this module ******************************************************************************** */ void elapsed_time_init (void) { uint32_t i; if (ARM_CM_DWT_CTRL != 0) { // See if DWT is available ARM_CM_DEMCR |= 1 << 24; // Set bit 24 ARM_CM_DWT_CYCCNT = 0; ARM_CM_DWT_CTRL |= 1 << 0; // Set bit 0 } for (i = 0; i < ELAPSED_TIME_MAX_SECTIONS; i++) { elapsed_time_clr(i); } } /* ******************************************************************************** * START THE MEASUREMENT OF A CODE SECTION ******************************************************************************** */ void elapsed_time_start (uint32_t i) { elapsed_time_tbl[i].start = ARM_CM_DWT_CYCCNT; } /* ******************************************************************************** * STOP THE MEASUREMENT OF A CODE SECTION AND COMPUTE STATS ******************************************************************************** */ void elapsed_time_stop (uint32_t i) { uint32_t stop; ELAPSED_TIME *p_tbl; stop = ARM_CM_DWT_CYCCNT; p_tbl = &elapsed_time_tbl[i]; p_tbl->current = stop - p_tbl->start; if (p_tbl->max < p_tbl->current) { p_tbl->max = p_tbl->current; } if (p_tbl->min > p_tbl->current) { p_tbl->min = p_tbl->current; } } /* ******************************************************************************** * CLEAR THE MEASUREMENTS STATS ******************************************************************************** */ void elapsed_time_clr (uint32_t i) { ELAPSED_TIME *p_tbl; p_tbl = &elapsed_time_tbl[i]; p_tbl->start = 0; p_tbl->current = 0; p_tbl->min = 0xFFFFFFFF; p_tbl->max = 0; }
elapsed_time.h
/*
********************************************************************************
*                       MODULE TO MEASURE EXECUTION TIME
********************************************************************************
*/

/*
********************************************************************************
*                MAXIMUM NUMBER OF ELAPSED TIME MEASUREMENT SECTIONS
********************************************************************************
*/

#define  ELAPSED_TIME_MAX_SECTIONS  10

/*
********************************************************************************
*                             FUNCTION PROTOTYPES
********************************************************************************
*/

void  elapsed_time_clr   (uint32_t  i);      // Clear measured values
void  elapsed_time_init  (void);             // Module initialization
void  elapsed_time_start (uint32_t  i);      // Start measurement
void  elapsed_time_stop  (uint32_t  i);      // Stop  measurement