Getting the worst-case circuit analysis with a minimal number of LTspice simulation runs
September 14, 2017

For worst-case analysis we?d prefer not to use a distribution approach. Rather, the maximum deviation from the nominal value of each component is used in the calculations.
When designing a circuit in LTspice, you might want to assess the impact of component tolerances, such as the gain error introduced by non-ideal resistors in an op amp circuit. Here, we’ll illustrate a method that reduces the number of simulations needed, and, therefore, speeds time to results.
LTSpice provides several ways to vary a parameter’s value:
- .step param: a parameter sweep of a user-defined variable
- gauss(x): a random number from Gaussian distribution with a sigma of x
- flat(x): a random number between -x and x with uniform distribution
- mc(x,y): a random number between x*(1+y) and x*(1-y) with uniform distribution.
These functions are very useful, especially if you want to look at results in terms of a distribution. But if you’re just looking for worst-case conditions, they may not be the quickest way to get a result.
Using gauss(x), flat(x) and mc(x,y), for example, will require a simulation to run for a statistically significant number of times. From there, a distribution can be looked at and worst-case values calculated in terms of standard deviations. However, for worst-case analysis we’d prefer not to use a distribution approach. Rather, the maximum deviation from the nominal value of each component is used in the calculations.
Running minimal simulations
Let’s say that we want to look at the worst-case impact of a R1 = 22.5 kΩ resistor with a 1 percent tolerance. In this case, we really only want to run the simulation with R1 = 22.5 kΩ * (1 - 0.01) and 22.5 kΩ * (1 + 0.01). A third run with an ideal 22.5-kΩ resistor would also be handy.
If we were just varying one resistor value, the ‘.step param’ method would work very well. But what if we have more? The classic difference amplifier has four resistors (Figure 1).
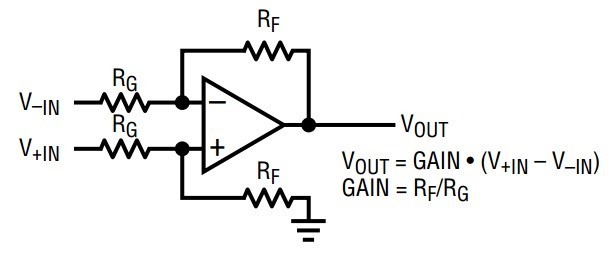
If a discrete difference amplifier were to be designed, each of these would have some tolerance (e.g., 1 percent or 5 percent). For an example, take the application shown in the LT1997-3 datasheet and implement it in LTspice with a discrete LT6015 op-amp and some non-ideal resistors (Figures 2, 3).
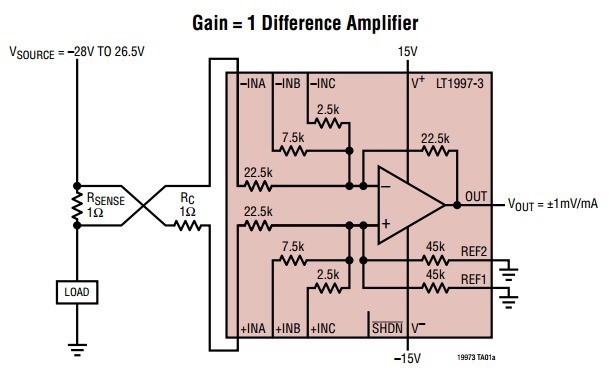
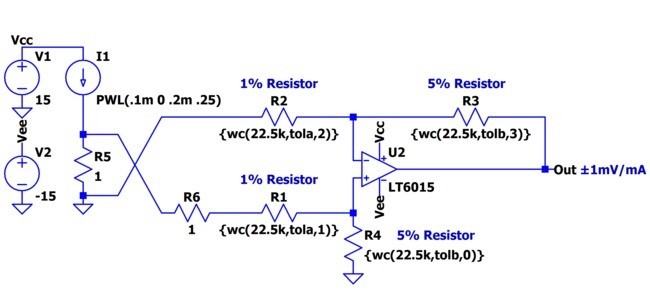
Figure 3. LT6015 difference amp with non-ideal resistors
Notice that the values of resistors R1 through R4 are replaced by a function call wc(nominalvalue, tolerance, index), which is defined in the simulation by a .func statement:
.func wc(nom,tol,index) if(run==numruns,nom,if(binary(run,index),nom*(1+tol),nom*(1-tol)))
This function, in conjunction with the next binary(run, index) function shown, vary the parameter for each component between its maximum and minimum values and, for the last run, the nominal value.
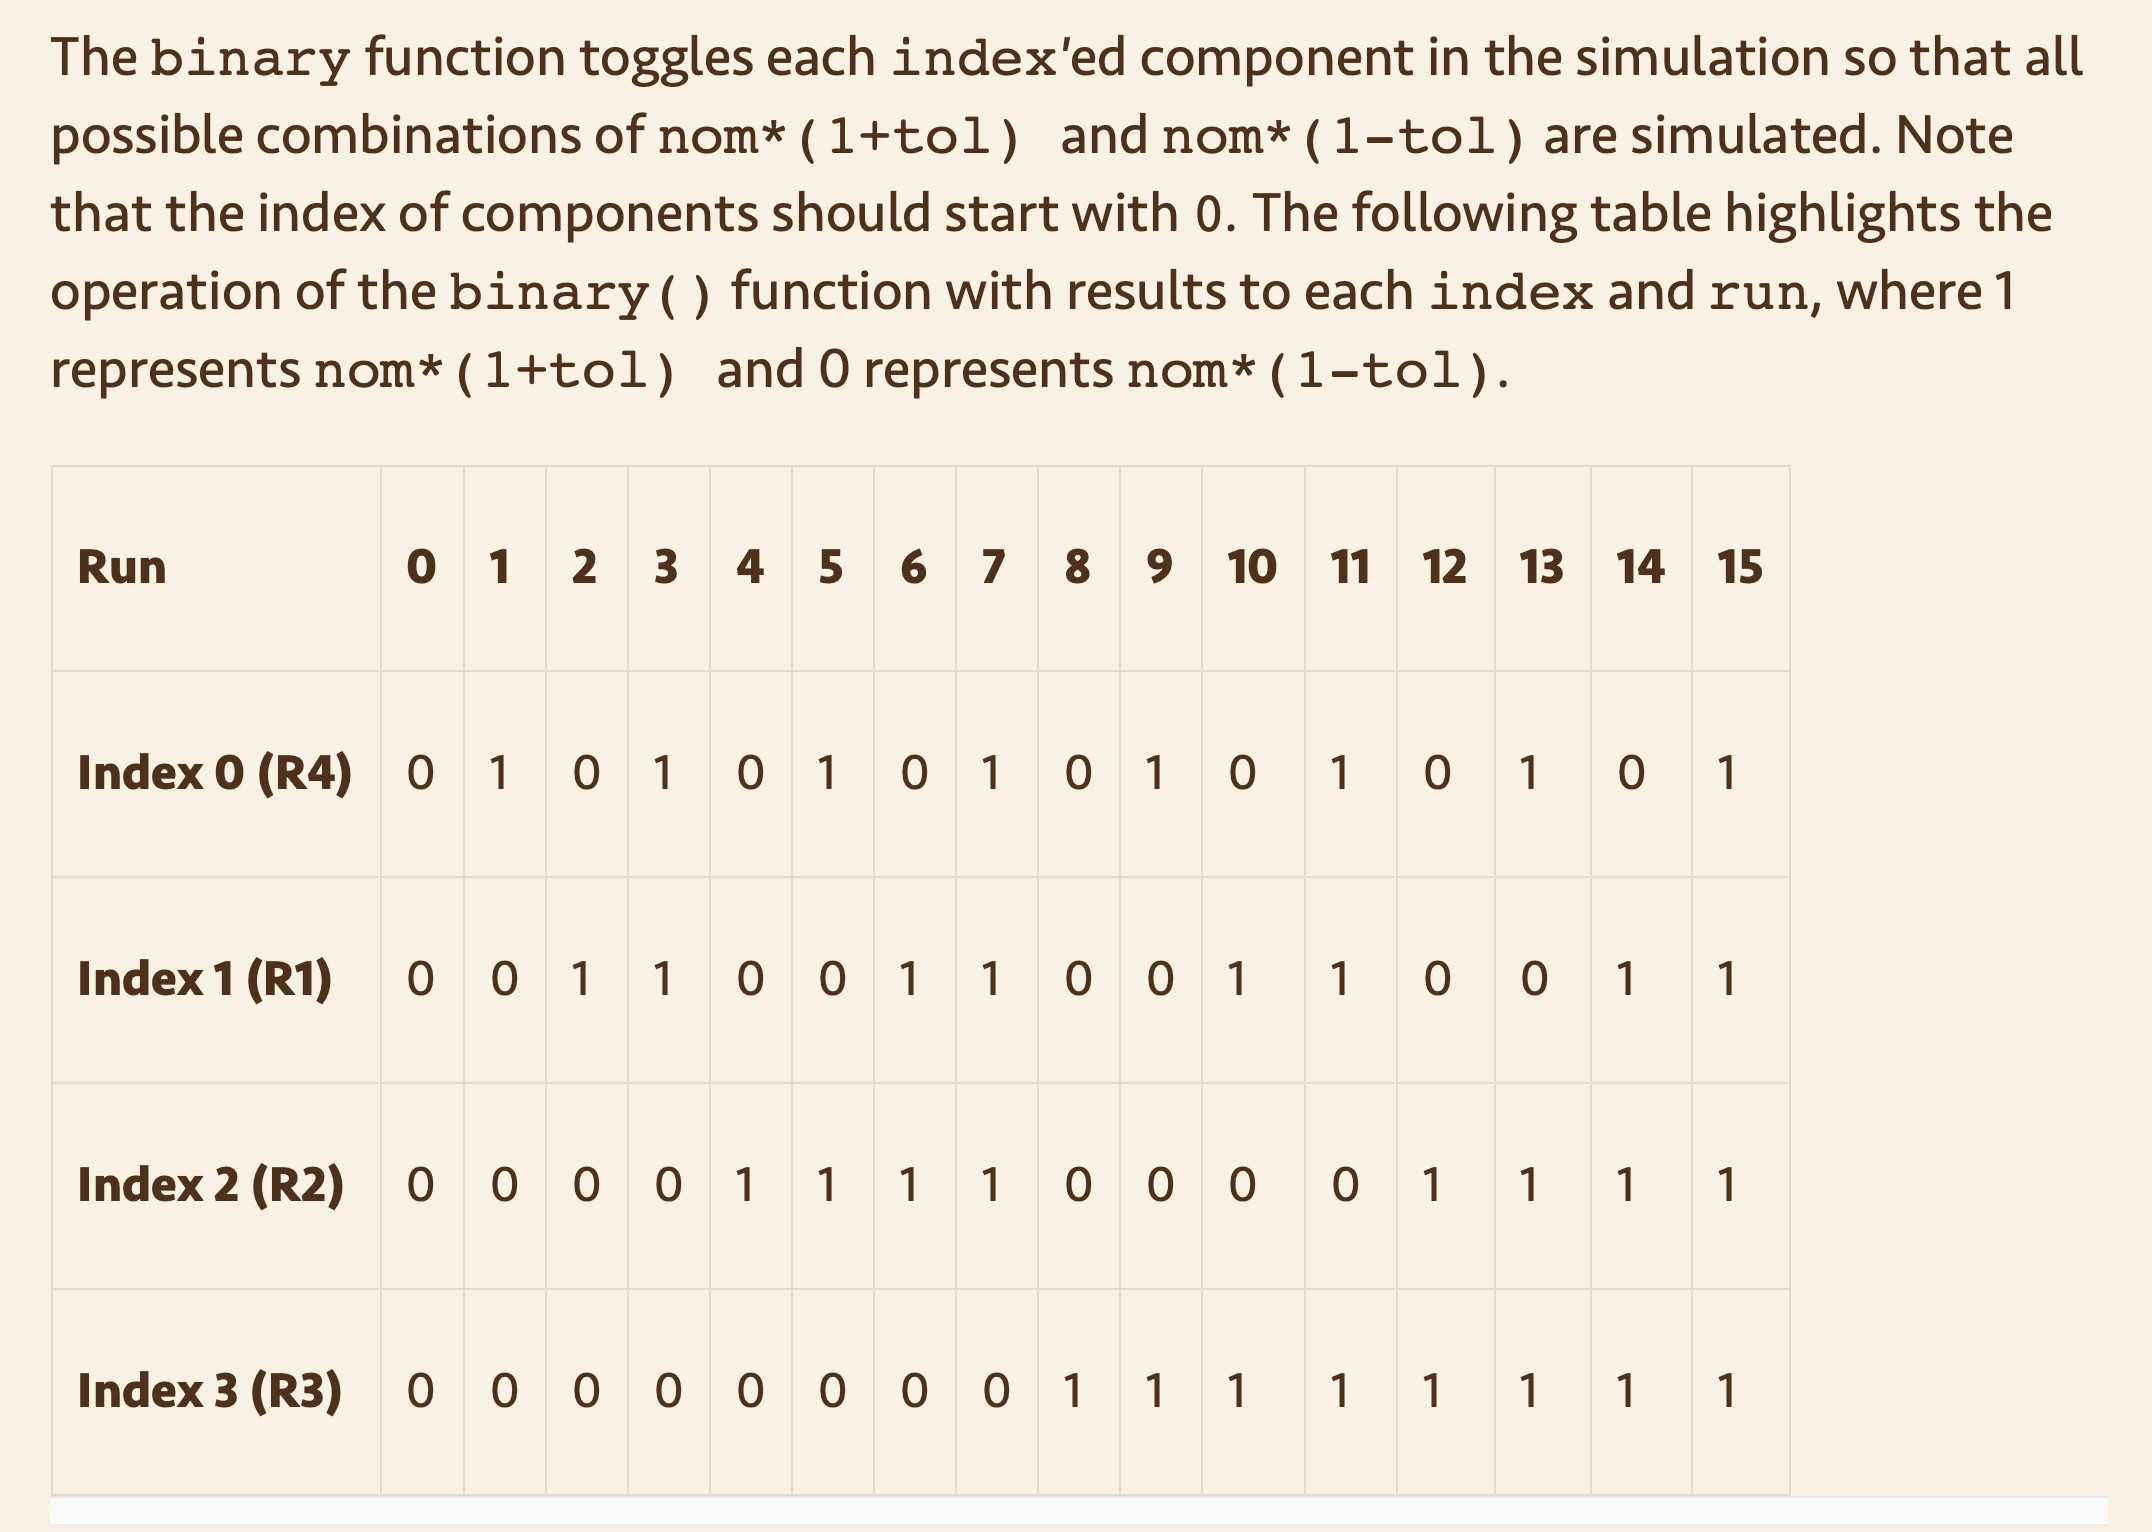
.func binary(run,index) floor(run/(2**index))-2*floor(run/(2**(index+1)))
The binary function toggles each index'ed component in the simulation so that all possible combinations of nom*(1+tol) and nom*(1-tol) are simulated. Note that the index of components should start with 0. The following table highlights the operation of the binary() function with results to each index and run, where 1 represents nom*(1+tol) and 0 represents nom*(1-tol).
.step param run 0 16 1The number of runs is determined by 2N +1, where N equals the number of indexed components needed to cover all of the device’s max and min combinations and the nominal. In our case, we need 17 simulations run and we can define this using the .step command and the .param statments:
.param numruns=16
Lastly, we need to define the tola and tolb for the simulation via .param statments:
.param tola=.01

.param tolb=.05
Plotting the .step'ed results
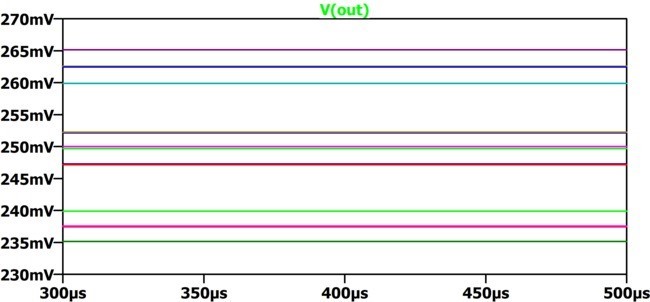
If the transient analysis simulation is run, see WorstCase_LT6015.asc file, where we can observe our results. For a 250-mA test current, the Vout net should settle to 250 mV. But now with our wc() function, we get a spread from 235 mV to 265 mV (Figure 4).
Plotting the .step'ed .meas statement
At this point, we could zoom in and look at the peak-to-peak spread. But let’s take a lesson from another LTspice blog, "Plotting a Parameter Against Something Other Than Time (e.g. Resistance)." This blog covers how to run a simulation several times and plot a parameter against something other than time. In this case, we want to plot the V(out) versus simulation run index.
In this simulation we have add a .meas statement to calculate the average voltage of the output:
.meas VoutAvg avg V(out)
To plot the V(out) versus run parameter, we can view the SPICE Error Log (Ctrl-L), right click, and select Plot .step’ed .meas data (Figure 5).
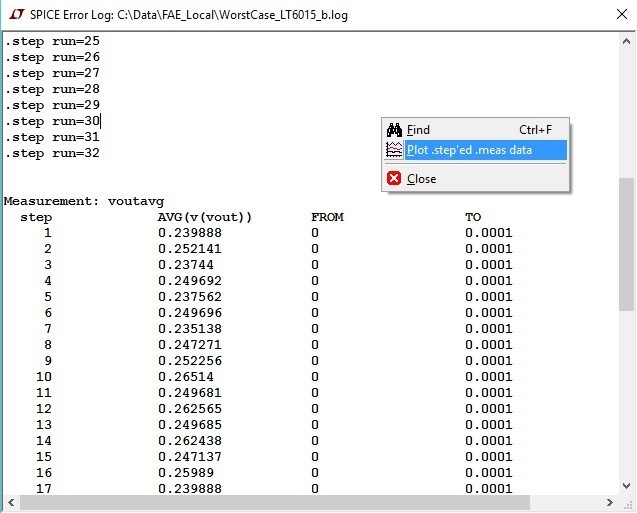
Figure 5. Spice error log interface
The plot in Figure 6 shows the results of our .step'ed .meas data.
Figure 6. Output voltage versus simulation run
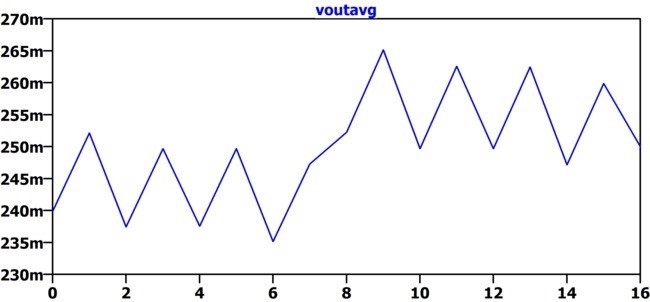
The trace shows us that the results vary from a maximum-worse case of 265 (run 9) to a minimum-worse case of 235 (run 6) or roughly a ±6 percent error. This makes sense since we had both 1 percent and 5 percent resistors in this example. The last run (16) shows the ideal result (250 mV), which uses ideal resistors. Another faster approach to this particular circuit is to use the .op simulation (instead of the .trans) to perform a DC operating point solution which will plot the results of our stepped .meas data directly.
The Value of Matched Resistors
When designing a difference amplifier, not only is the appropriate op-amp needed, but matching the resistors is equally as important. The following references do a good job of explaining this topic (and associated math) in detail:
However, you can neither achieve good Common Mode Rejection Ratio (CMRR) or Gain Error without appropriately matched resistors.
Linear Technology has a number of precision amplifier products that also include matched resistors, such as the LT1997-3, with 91 dB minimum DC CMRR and 0.006 percent maximum gain error.
References
Monte Carlo and Worst-Case Circuit Analysis using LTSpice
Joseph Spencer is a Field Applications Engineer and Gabino Alonso is a Strategic Marketing Engineer, both for Linear Technology Corp.
Linear Technology, part of Analog Devices
LinkedIn: www.linkedin.com/company/linear-technology
Facebook: www.facebook.com/LinearTechnologyCorporation
Google+: plus.google.com/+lineartechnology
YouTube: www.youtube.com/user/LinearTechnology
This article originally appeared on the Linear Technology website.