Don't get beat by USB 3.1 Gen 2 cable-assembly test challenges
January 21, 2015

Higher data rates (10 Gbps) require new test methodologies to ensure interoperability. Driven by the demand for more bandwidth, high-speed digital sta...
Higher data rates (10 Gbps) require new test methodologies to ensure interoperability.
Driven by the demand for more bandwidth, high-speed digital standards continue to evolve to higher data rates. The 10 Gbps USB 3.1 specification delivers more than double the practical data rate compared to the current 5 Gbps USB 3.0 by implementing a more efficient data encoding scheme. This higher data rate results in tougher requirements for the cable assembly to ensure interoperability. New test methodologies and measurement items are introduced in USB 3.1.
In general, the expression Gen 1 SuperSpeed, or Gen 1 USB 3, refers to the 5 Gbps signaling rate. Gen 2 refers specifically to the 10 Gbps signaling rate. SuperSpeed is used when referring to architecture layer portions when operating with a Gen 1 PHY, and SuperSpeedPlus refers to the architecture layer portions for a Gen 2 PHY.
USB 3.1 cable assemblies provide the same functionally and interface mating interoperability as USB 3.0. The primary differences are that USB 3.1 cable assemblies are specifically intended to support the 10 Gbps data rate and they include features associated with improved RF interference (RFI) performance. The complete list of measurement parameters defined in the USB 3.1 cable/connector specification is shown in Figure 1.
|
|
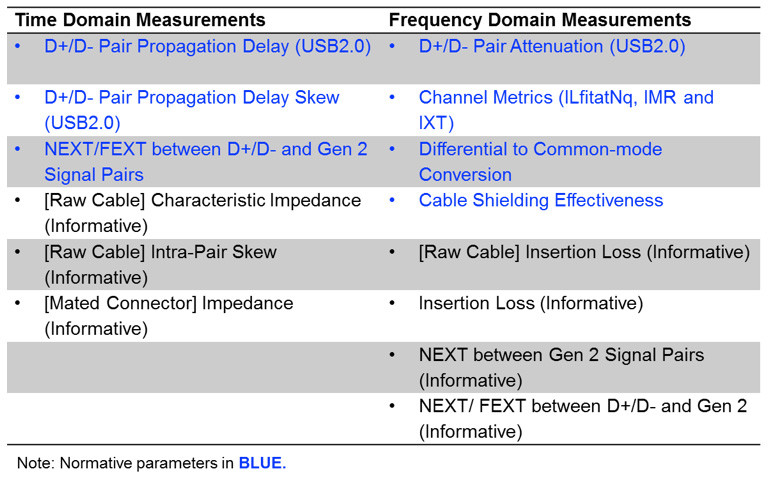
There are both time- and frequency-domain measurements, which are divided into informative and normative requirements. The informative requirements are provided as design targets, and normative requirements are used as pass/fail criteria for compliance testing. Although cable assemblies that meet the informative design targets should pass the compliance tests, it’s not a guarantee. Compliance is determined with the normative requirements. The normative requirements manage the impact of insertion loss, reflection, and crosstalk with the Channel Metrics, and RFI with mode conversion. Cable assemblies meeting Gen 2 requirements don’t require separate testing for Gen 1 compliance.
|
|

Gen 2 cable assembly test challenges
As the data rate has doubled to 10 Gbps in Gen 2, 1UI is now 100 ps. Due to tighter device margins, improvements in both the cable and connector design are required. Several changes have been made to the specification to manage these design challenges and to ensure interoperability.
First, to ensure that the measurement isn’t affected by the test environment (such as test fixtures), a more rigorous approach to removing fixture effects is required. In addition, improvements in the pass/fail judgment method are required. The cable assembly performance is affected by many parameters, such as loss, reflection, and crosstalk.
The traditional method consisted of measuring these parametric parameters, and testing to limits defined for each parameter. The limitation of this method is that it doesn’t allow for the trade-offs between each of the test items. Due to tighter margins, a new methodology is required to ensure sufficient yield. Finally, there have been reports of RFI issues with USB 3.0. A new section is added in the spec to manage RFI levels from the cable assembly.
Removing fixture effects from measurement
Test fixtures are required to connect from the test equipment to the cable assembly. At the 10 Gbps data rate, it’s essential to remove the effects of the fixture traces. The “2x thru de-embedding” and “in-fixture TRL calibration” methods are introduced in the USB 3.1 Cable and Connector Compliance Specification draft.
For 2x thru de-embedding, full calibration is performed with an electronic calibration unit (Ecal) to establish the calibration reference plane at the end of the test cables. Then, the S-parameters of the fixture traces are de-embedded to extend the reference plane to the edge of the USB connectors, effectively removing the effects of the fixture from measurement. The key to the de-embedding method is the quality of the fixture traces’ S-parameters. The Automatic Fixture Removal (AFR) feature is recommended to obtain these S-parameters (note that the AFR function is available on Keysight’s N1930B physical-layer test system software).
An alternative method is in-fixture TRL calibration, which was initially integrated into the USB 3.0 spec and also applies to USB 3.1 Gen 2. Compared to the 2x thru AFR method, additional standards are required. After completing the calibration, the reference plane is extended to the edge of the USB connectors.
A differential insertion loss measurement example of a prototype USB 3.1 cable assembly, using both techniques to remove the effects of the fixture, is provided in Figure 3. The limit shown is for the USB Type-C cable assembly. As can be seen, not removing the test fixture effects (red trace) can be the difference between passing and failing a test item. The AFR (orange trace) and TRL (blue trace) results overlap each other, providing excellent correlation between the two methods.
|
|

New compliance methodology
Interconnects have traditionally been characterized by measuring parametric parameters, such as impedance/skew in the time domain and insertion loss/return loss in the frequency domain. One challenge with such characterization is how to translate the measurement results into what the eye diagram will look like at the end of a link. Even if the eye coming out of the transmitter is known, it’s difficult to calculate the eye diagram after it traverses the channel from parametric values. At the end of the day, digital engineers are concerned about eye opening. Not being able to determine this parameter is a limitation of parametric measurements.
Another limitation of the traditional parametric measurement is that it doesn’t allow tradeoffs among the various test parameters. For instance, the channel with less loss could tolerate more crosstalk or reflection, and vice versa. Because the parametric specification needs to guarantee interoperability for cables that marginally pass all the parametric test items, the limits are set conservatively. There will be cables that marginally fail in one or two parametric test items and pass other items with sufficient margin. Therefore, there’s a possibility of rejecting a functioning cable assembly.
Another approach, which is starting to appear in the latest high-speed serial standards, is to characterize the interconnect using an eye diagram. This allows direct observation of eye characteristics at the end of the link. With this measurement, called “stressed” eye diagram analysis, the expected worst-case transmitter performance is applied as the “stressed” signal to the cable assembly and the cable assembly output is evaluated with an eye diagram. If the interconnect can correctly transmit a stressed signal with eye characteristics equal to or better than what’s specified at the receiver input, then it should operate with the signal of any compliant transmitter.
The Gen 2 implementation of stressed eye diagram analysis is based on the Channel Metrics. Three signal-integrity impairments impact the end-to-end link performance: attenuation, reflection, and crosstalk. The compliance specification is all about managing these three impairments. To represent them, three parameters represent the Channel Metrics: insertion loss fit at Nyquist frequency (ILfitatNq), integrated multi-reflection (IMR), and integrated crosstalk (IXT).
The ILfitatNq is calculated by applying curve fitting to the insertion loss measurement result. The difference between the insertion loss measurement and the smoothing curve, or the ripple of the insertion loss, represents the IMR. The IXT is defined as the integrated sum of all crosstalk sources between the Gen 2 signal pairs. The pass/fail judgment is then performed by the USB 3.1 standard tool based on these Channel Metrics.
After loading the measured cable assembly S-parameters into the tool, the parameters are combined with the reference host and device S-parameters to form the full channels. Then the tool performs a pass/fail assessment, based on the eye height (eH) and eye width (eW). This tool, provided by the USB-IF, will be integrated into the Gen 2 compliance test suite, in the USB Cable Connector compliance program.
Note: The correlation between the eH/eW and the Channel Metrics (ILfitatNq, IMR, and IXT) is established following the methodology described in the USB-IF whitepaper, Methodology Used to Determine SuperSpeed USB 10 Gbps (USB 3.1) – Gen 2 Channel and Cable Assembly High Speed Compliance.
Figure 4 shows several pass and fail examples from the USB 3.1 spec. Each plot is calculated based on a specific ILfitatNq value. The x-axis is IMR and the y-axis is IXT. The green area represents the passing region with open eyes, while the red area is the failing region with closed eyes. The passing area increases as ILfitatNq decreases. This pass/fail criteria allows tradeoffs among ILfitatNq, IMR, and IXT. For example, a cable assembly may have more loss if IMR and/or IXT is smaller.
|
|
Managing RFI
Although some known techniques to reduce RF interference (RFI), such as spread spectrum clocking and data scrambling, have been applied, RFI issues have been reported for USB 3.0. USB 3.0 hosts can interfere with devices such as wireless mice and keyboards. While most well designed wireless devices don’t stop working, their range may be limited by the RF leakage from the USB 3.0 device. For USB 3.1, the RFI is reduced by the introduction of a new standard A-receptacle with more grounding fingers and better overall shielding to prevent RF leakage. In addition, a new section is added in the specification, requiring cable shielding effectiveness measurements to manage cable radiation.
The cable shielding effectiveness test measures the RFI levels from the cable assembly. To perform the measurement, the cable assembly is installed in the cable shielding effectiveness test fixture, which is currently under development by the USB-IF. The coupling factors from differential mode to cable shield (Ssd12) and common mode to cable shield (Ssc12) are measured for the transmit and receive signal pairs.
Several key topics aimed to ensure interoperability at the Gen 2 data rates have been introduced. The 2x thru de-embedding using AFR and TRL calibration removes test fixture effects, enabling you to measure your device’s true performance. In addition, there’s a paradigm shift in the measurement methodology from the traditional parametric testing to stressed eye diagram testing (based on Channel Metrics) to directly correlate to the end-to-end link performance. Finally, the Cable Shielding Effectiveness specification is being finalized by the USB-IF to manage RFI levels from the cable assembly.