When Correct Outputs Aren't Enough: Testing Edge AI for Hidden Timing Failures on Shared Silicon
June 01, 2026
Blog
Edge AI systems on shared-silicon platforms can produce stable, accurate outputs while violating real-time deadlines under realistic deployment contention, a failure mode that accuracy-based validation cannot detect. This article presents a same-hardware controlled experiment on an NVIDIA Jetson Orin Nano Super demonstrating the gap, and proposes a joint verification condition combining an output-stability metric with a tail-latency bound that engineers can apply to their own systems.
The Paradox
Two execution paths run on the same NVIDIA Jetson Orin Nano Super. Same MobileNetV2 model, same 500-image test set, same combined deployment load: 75 percent CPU stress, 50 percent memory fill, four BLE connections, and concurrent disk I/O.
One path delivers inferences with a P99 latency of 10.9 ms. The other reaches 165.1 ms at the 99th percentile, exceeding a 100 ms deadline by 65 percent.
Both paths pass accuracy testing. Top-1 prediction differences stay below 1 percent. Output stability holds inside a tight bound across all 107,500 inferences in the campaign. From a typical pre-market validation perspective, the two paths look equivalent.
They are not. One is deployable in a 10 Hz control loop. In the other, one inference in every hundred takes long enough to break the loop entirely.
This is not a tooling issue or an exotic edge case. It is a validation gap in how AI-enabled embedded systems are evaluated, and it shows up most sharply on the same shared-silicon platforms the edge AI industry is converging on. Figure 1 shows the architectural setup.
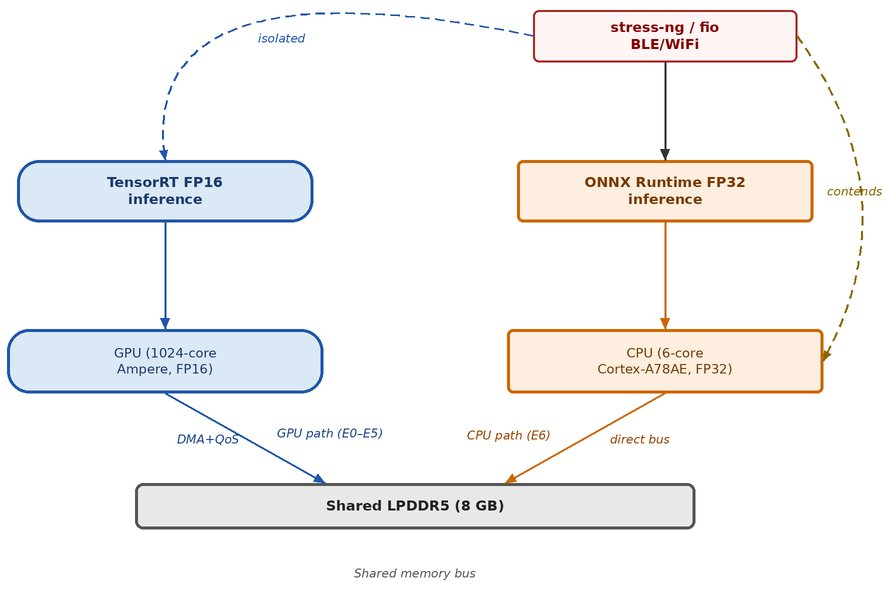
Figure 1. Two execution paths on a Jetson Orin Nano Super. The GPU path uses dedicated DMA channels with QoS bandwidth reservation; the CPU path competes directly for shared bus bandwidth with stressor workloads. (Source: author.)
What Accuracy Testing Cannot See
Pre-market validation of AI-enabled embedded systems leans heavily on accuracy under controlled conditions. Sensitivity, specificity, AUC, and similar metrics evaluate the argmax of an inference output. They carry no information about whether successive outputs arrive on time.
A device specified to operate at 10 Hz produces one inference activation every 100 ms. If an activation requires 165 ms, the control loop stalls regardless of whether the output is numerically correct. Output correctness and timing reliability are structurally independent properties, and standards including IEC 62304 Clause 6.3.2 and the FDA's 2025 draft guidance on AI-enabled device software (FDA-2024-D-4488) already call for timing verification under foreseeable conditions of use, yet accuracy-focused certification protocols typically do not operationalize this requirement at the inference layer under deployment load.
A 2025 cross-sectional study of FDA-cleared AI-enabled medical devices identified 60 devices subject to 182 recall events, with 43 percent occurring within the first year of clearance. Not all of these are timing failures. But late delivery of an otherwise correct output is a failure mode that current pre-market protocols can systematically miss.
The Same-Hardware Test
To isolate timing as a property of the execution stack rather than of the silicon, the experiment used a single Jetson Orin Nano Super with two execution paths.
GPU path: TensorRT FP16 on the 1024-core Ampere GPU, with dedicated DMA channels and QoS bandwidth reservation on the shared LPDDR5 bus.
CPU path: ONNX Runtime FP32 on the 6-core Cortex-A78AE, competing directly with stressor workloads for CPU time, cache, and DRAM bandwidth.
Same chip, same memory, same thermal envelope, same model architecture, same test set. The differences are runtime (TensorRT vs. ONNX Runtime), numerical precision (FP16 vs. FP32), and architectural isolation from the shared bus. Architectural isolation is the dominant factor: the GPU path uses dedicated DMA channels and QoS bandwidth reservation that effectively partition it from stressor workloads, while FP16 vs FP32 affects compute time by a small constant factor and does not explain order-of-magnitude tail-latency differences under contention. Any divergence is therefore primarily attributable to the execution stack rather than to board-level differences.
The validation campaign covered six stressor conditions: zero load (E0), CPU stress at 25, 50, 75, and 100 percent (E1), and combined load (E5: CPU 75 percent plus 50 percent memory fill, four BLE connections, and concurrent disk I/O via fio, the standard Linux I/O benchmark). Each condition ran for 10 trials of 500 inferences per path. Tegrastats monitoring confirmed no thermal throttling during any trial.
Defining Output Stability Separately from Accuracy
Accuracy testing observes only the predicted class. It cannot detect a model whose softmax confidence has shifted by, say, 4.99 percent under load while the argmax stays put. To make subthreshold drift observable, the experiment uses an output-stability metric proposed under the name Safety-Threshold Exceedance Rate (STER).
STER measures how often an inference output deviates from its zero-load reference by more than a predefined threshold. For each inference under stressor condition c, the per-inference deviation from a zero-load reference is the maximum per-class change of the softmax output. Counting the fraction of inferences where that deviation exceeds a stability threshold T* gives:
STER_c = fraction of inferences with max-class softmax deviation > T*
This experiment used T* = 0.05, intentionally below typical tolerance bands. STER is a candidate metric, not an FDA-specified standard. The specific value of T* matters less than the point: some output-stability metric independent of argmax accuracy is necessary to distinguish numerical-instability problems from timing problems under load.
What the Joint Test Reveals
Across all 107,500 inferences in the campaign, both paths held STER at 0.0000. The maximum per-inference deviation never exceeded 0.025, half the threshold. Output stability was confirmed.
Latency told a different story. The GPU path remained at roughly 10.6 ms mean and 10.9 ms P99 across every condition tested: zero load, CPU stress from 25 to 100 percent, memory pressure up to 90 percent fill, BLE plus WiFi RF stress, and the combined load. The CPU path degraded monotonically: 14.5 ms mean at idle, 73.7 ms at 75 percent CPU load, 104.0 ms mean and 165.1 ms P99 under combined load. Figure 2 shows the latency distributions.
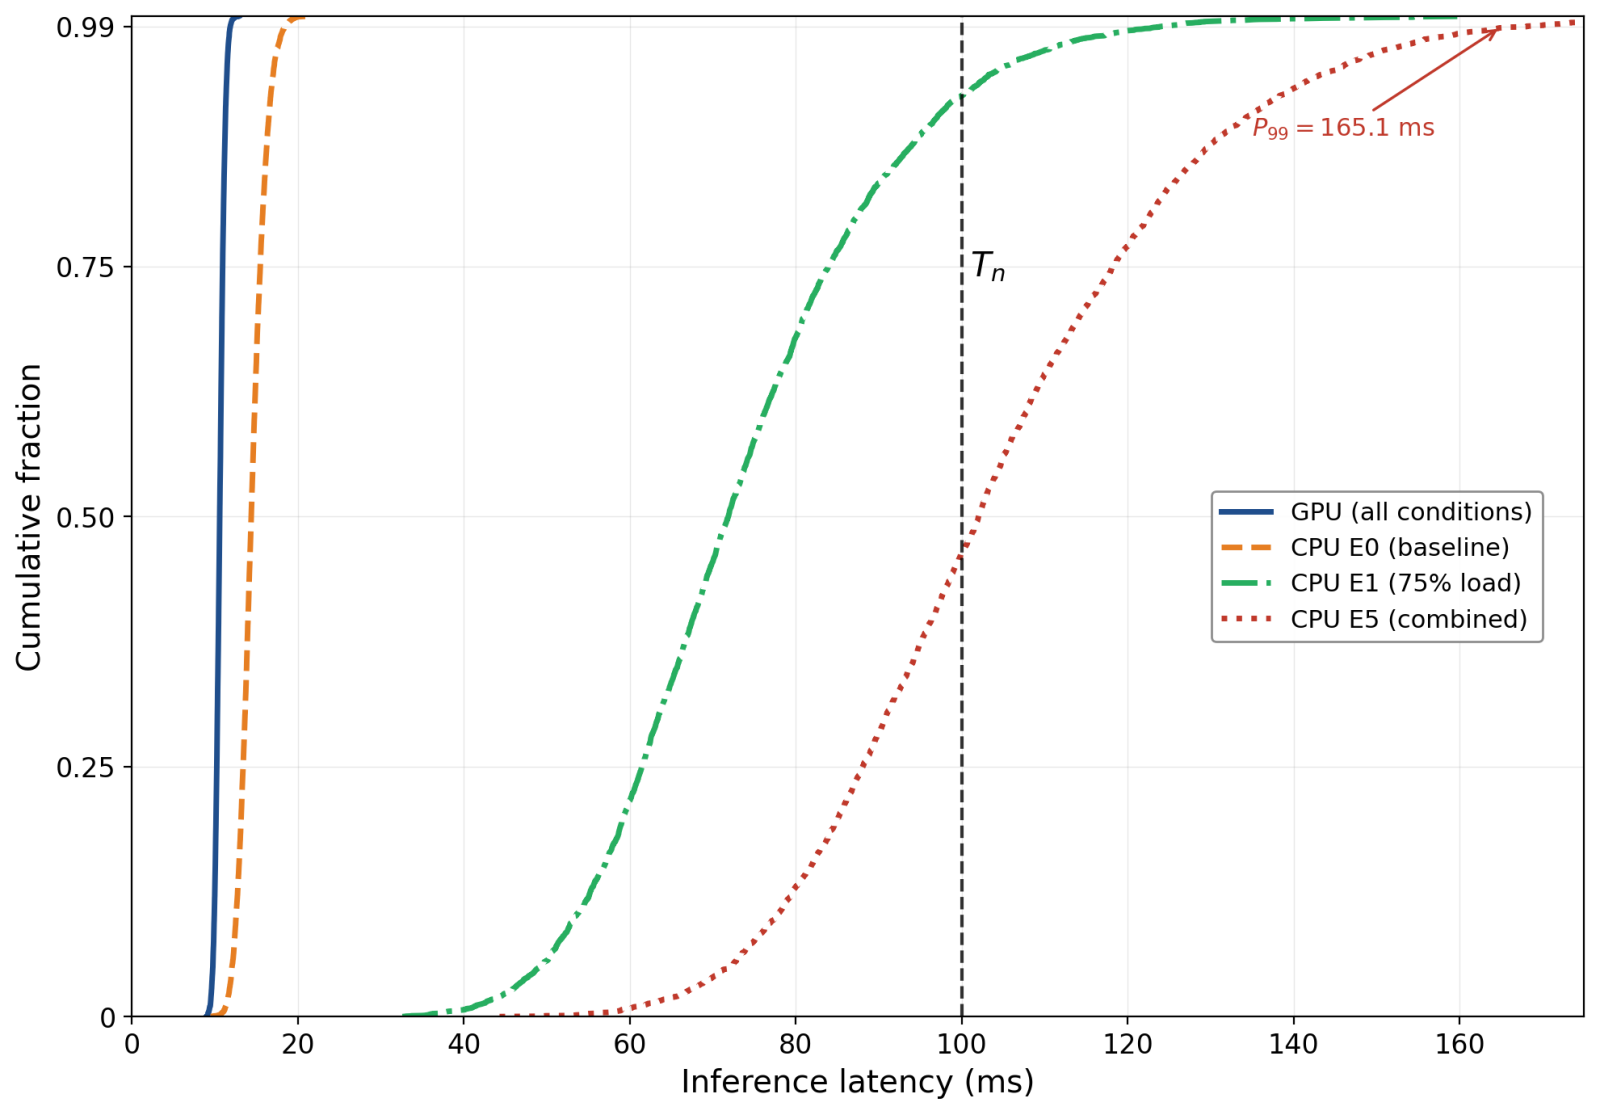
Figure 2. Empirical CDF of inference latency. The GPU path stays inside a tight band around 10.9 ms across all conditions. The CPU path degrades as contention rises, with the combined-load case (red, dotted) crossing the 100 ms deadline at the 75th percentile and reaching P99 = 165.1 ms. (Source: author.)
A manufacturer running accuracy-only tests would clear both paths as equivalent. A manufacturer running mean-latency tests would catch the difference but might miss the tail. The CPU path's 104 ms mean is already over budget, but the 165 ms P99 is where deployment-infeasibility lives. One inference in a hundred is enough to break a real-time loop.
The mechanism shares SoC resources without QoS reservations. The CPU path's ONNX Runtime inference contends for the same cores, cache, and LPDDR5 bandwidth as the stressor workloads. The TensorRT FP16 path executes on the GPU compute domain with DMA channels that bypass the contended path. The 9.8x latency difference under combined load is a consequence of architectural isolation.
The joint condition that distinguishes the paths is straightforward:
STER_c <= STER_max AND latency_P99 <= T_n
where T_n is the nominal cycle period (100 ms at 10 Hz, in this experiment). Neither test alone is sufficient. STER alone confirms output correctness while saying nothing about deadlines. Latency alone, especially mean latency, can hide tail failures and cannot distinguish scheduling pressure from numerical instability. Figure 3 plots STER against mean latency for every condition tested.
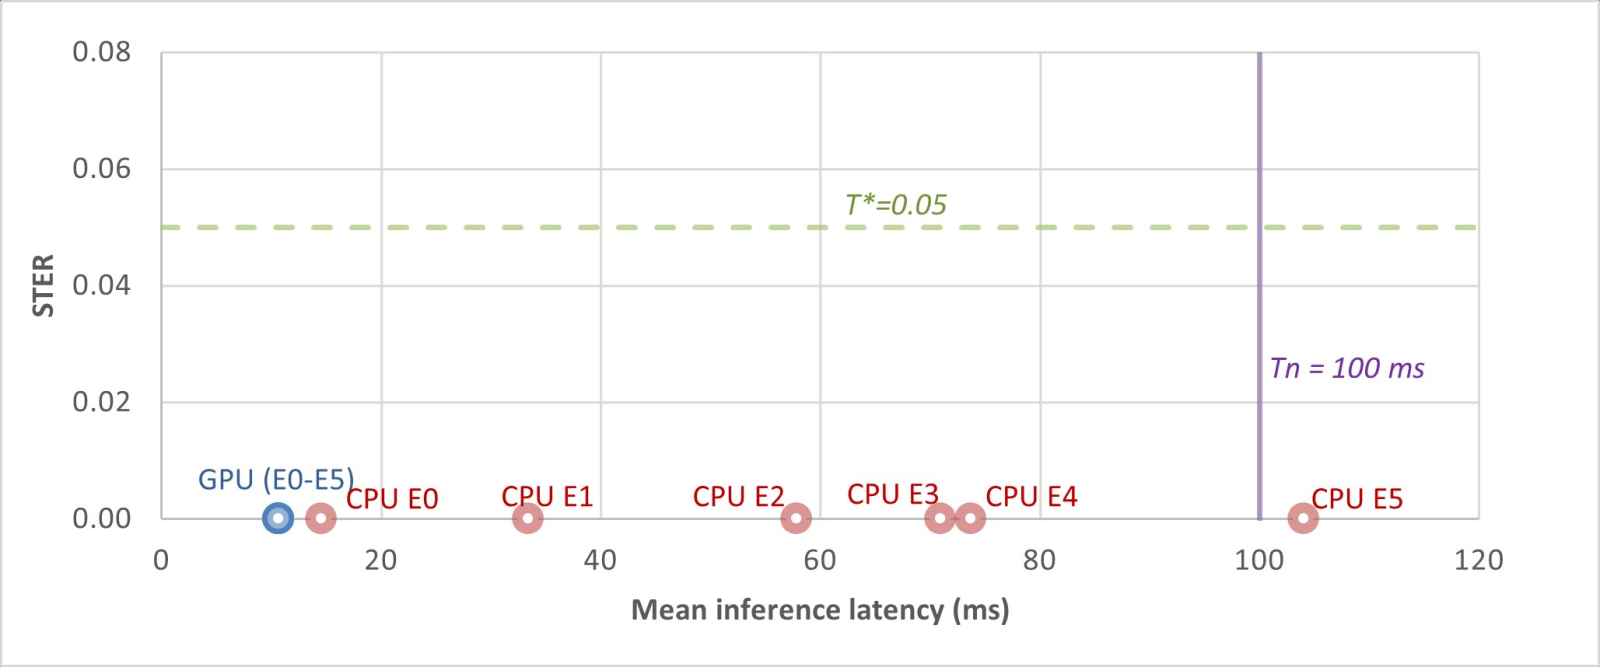
Figure 3. STER vs. mean inference latency for every tested condition. Both paths sit at STER = 0 across all conditions, well below the T* = 0.05 threshold. The GPU path stays well to the left of the deadline T_n; the CPU path, under combined load (rightmost red marker), crosses it. Accuracy-only validation cannot see this; the joint condition can. (Source: author.)
What This Means for Engineers Building Edge AI Systems
Five practical implications, ordered roughly by how often they get missed in real validation work.
1. Test execution paths against each other on the same hardware. Cross-board comparisons confound architectural isolation with everything else that changes between platforms. If you have an alternative execution path, test it against the primary path on the same chip under the same load.
2. Validate output stability as a property distinct from accuracy. Argmax-only validation is blind to subthreshold output drift that real systems can exhibit under load. A defined deviation metric and threshold close the gap.
3. Measure the tail, not the mean. P99 and worst-case latency are where deadline failures live. If your safety case requires 99.9 percent of inferences to meet the deadline, P99 is the floor for what to measure.
4. Run validation under contention, not on idle benchmarks. The Jetson CPU path's 9.8x latency degradation between idle and combined load was not visible at any single-stressor condition in isolation. Test against the foreseeable operating envelope, not the convenience of the rig.
5. Treat timing as part of correctness, not as a performance metric. A system that produces the right output at the wrong time has failed. Define your latency budget as a hard requirement and validate against it at the percentile that matters for your safety case.
Beyond the Medical Example
The medical-device example is sharpest because of the current FDA AI/ML draft guidance, but the failure mode is general. Industrial control, robotics, and automotive perception loops all run against cycle deadlines. Any closed-loop embedded AI system on shared silicon is exposed to the same risk: contention on shared compute and memory resources can degrade an architecturally non-isolated execution path's tail latency without producing any signal that accuracy-based validation can detect.
The fix is methodological, not heroic. Joint verification of output stability and tail latency, under realistic contention, on the same hardware the device will ship on, exposes the failure mode that accuracy alone misses. The cost is measured in days of lab time, not in a hardware respin.
What the right thresholds are for specific applications, and whether protocols of this kind belong in pre-market regulatory frameworks, are open questions. The narrower question, the one engineers can act on now, has an answer: the failure mode is real, and a defined protocol can catch it before deployment.
Resources
Full experimental protocol, raw results, and analysis code: github.com/akulswami/p2-edge-ai-samd. Underlying manuscript available as an arXiv preprint: arXiv:2604.23831.
Akul Swami is an independent researcher in runtime assurance for safety-critical edge ML systems, with nine-plus years of embedded software engineering experience in regulated industries. Site: akulswami.github.io. ORCID: 0009-0003-9549-5543.

Akul Swami is an independent researcher in runtime assurance for safety-critical edge ML systems, with nine-plus years of embedded software engineering experience in regulated industries. Site: akulswami.github.io. ORCID: 0009-0003-9549-5543.