Beyond the Data Sheet: Using Benchmark Testing to Calculate Battery Life
January 18, 2021
Story

Deciding on which wireless IC to use for battery-powered IoT products is often a difficult task. Product developers often must compare several wireless ICs to understand the impact they will have on a product.
Deciding on which wireless IC to use for battery-powered IoT products is often a difficult task. Product developers often must compare several wireless ICs to understand the impact they will have on a product.
Although data sheets are a good starting point for comparing devices, they are not always representative of real-world performance. In addition, other factors must be considered that may not be adequately covered in a data sheet, such as wakeup times, radio transition times, peripheral activity, and transmit (TX) and receive (RX) times. Software stacks can also have an impact on battery life, and efficiency can vary between vendors. For these reasons, a more comprehensive approach is needed to fully understand the differences between competing devices. Such an approach should include a review of key data sheet specifications and non-data sheet items, as well as benchmark testing to accurately measure power consumption and battery life.
Data Sheet Specifications
When comparing ICs, designers often first look to data sheets. However, data sheets do not always provide “apples-to-apples” comparisons. Even specifications that appear to be the same across data sheets may be measured differently and may not represent what designers see once the specifications are implemented at the product level.
The following figure presents four 802.15.4/BLE devices from different vendors. This chart shows how similar specifications may be represented differently in product data sheets and how this could impact battery life.

Figure 1: Data Sheet Key Spec Comparison
For example, Max TX power is just one example of a device specification that may not accurately represent real-world applications. Though easier to find with a data sheet comparison, in some cases, there may be caveats or missing information. For example, some devices may require a higher voltage to run at higher power. In Figure 1, Vendor D requires 3 V to operate at +8 dBm, whereas Vendor C can operate up to +13 dBm at 1.8 V. So, for devices on batteries, Vendor D will have to operate at less than +8 dBm for most typical battery lifetimes.
Other key data sheet specifications that may not represent real-world applications include security encryption operations, sleep current and active current, radio current, link budget and supply voltage. Different vendors may use different means of measuring these specs or may list them differently in their data sheets, but these variations can have a significant impact on device performance and battery life.
Non-Data Sheet Items
Other specifications for wireless devices, such as transitions to and from sleep modes, DC-DC efficiency across voltage ranges, and RF performance, can have a significant impact on battery life but may be difficult to evaluate based on data sheet information. For example, μA per meter is a good indicator of power consumption for RF activity, however, developers must look at both range and μA per meter to see if a device is a good fit for their application. In Figure 2, Vendor B has one of the lower μA-per-meter values, but if you look at the range, it is the lowest of all four vendors. From this comparison, Vendor C has the best range and the lowest μA-per-meter values.

Figure 2: μA per Meter
Protocol Stacks
Protocol stacks are another feature to consider when calculating performance and battery life. Protocol stack memory requirements may affect how much memory is available to product developers, while the timing and efficiency of the protocol stacks directly affects battery life. Specific protocol features have an impact on battery life as well. A chatty network may result in RX and TX current consumption being a greater part of overall battery discharge, for example, whereas a very sleepy network may rely more on sleep currents. And, of course, protocols with smaller payloads will result in more packets to send data, which generates more network traffic and increases RF transmissions. Each of these factors can have a direct impact on memory, robustness, and battery life.
Benchmarking
Benchmarking is really the only way to accurately measure power consumption and battery life because it provides more accurate real-world results for hardware and software solutions than data sheets. One of the simplest means of benchmarking is to use a vendor-provided calculator, which enables the user to see the effect that different sleep, transmit, and receive currents can have on total power consumption.
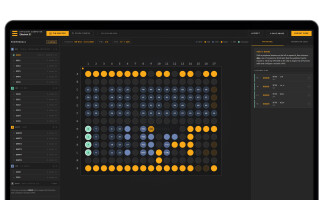
Figure 3 is a great example of why benchmarking is important. This is a BLE slave example in which the device wakes up, receives a packet, transitions to a TX, processes the data, and then goes back to sleep.
Figure 3: Benchmarking Comparison
Based on a data sheet comparison between the two vendors, Vendor E would appear to have about 30 percent lower current consumption. However, based on benchmarking, Vendor C is shown to have about 50 percent lower current consumption for the entire transaction. This is based on several factors:
- Wakeup time: The timing for Vendor E to wake up and stabilize before transmitting is much longer than for Vendor C. This could be due to the IC wakeup time and/or the efficiency of the BLE stack.
- TX and RX current: Vendor E’s power consumption for TX and RX are much higher than indicated in the data sheet. The data sheet values for vendor E were around 6 mA for TX and RX, while measurements showed them to be around 10 mA for TX and 9 mA for RX. Vendor C was also higher than the data sheet, but only by about 1 mA.
- Processing and sleep transition time: Vendor E has a very long post connection time before the device goes to sleep. Again, this might be due to the IC, stack efficiency, or a combination of the two.
Comparing data sheets alone does not provide an accurate picture of the differences between competing wireless IC devices. Developers must consider other factors beyond the information provided in the data sheet that affect current consumption and real-world performance. Conducting a review that includes comparisons of key data sheet specifications, non-data sheet items, and benchmark testing will enable developers to make the best choice for their application.
Matt Maupin is a Senior Product Manager at Silicon Labs, responsible for IoT wireless SoC platforms. Matt joined Silicon Labs in 2012 and has been in the semiconductor industry for over 20 years, defining and launching wireless ICs and modules, including Wi-Fi®, Bluetooth®, Zigbee, Z-Wave and proprietary solutions. Mr. Maupin has been active in numerous industry groups for wireless communication including the Bluetooth SIG, Zigbee Alliance and IEEE, and has authored multiple papers for trade conferences and publications.

Matt Maupin is a Senior Product Manager at Silicon Labs, responsible for IoT wireless SoC platforms. Matt joined Silicon Labs in 2012 and has been in the semiconductor industry for over 20 years, defining and launching wireless ICs and modules, including Wi-Fi®, Bluetooth®, Zigbee, Z-Wave and proprietary solutions. Mr. Maupin has been active in numerous industry groups for wireless communication including the Bluetooth SIG, Zigbee Alliance and IEEE, and has authored multiple papers for trade con