Debugging the Android platform on ARM-based designs
February 01, 2010
An Android-aware debug and analysis framework can enable a deterministic and successive top-down debug approach.
Bringing up Android on a new device cannot be accomplished without touching the internals of the Android software stack. While the Java application layer remains to a large extent unmodified, work must be done in the Java native layer, the hardware adaptation layer, and the underlying Linux kernel and its drivers. Furthermore, device-specific services and applications need to be integrated and tested along with the rest of Android.
Vertically integrating a device feature across all those layers in the software stack is a fair challenge. Isolating and debugging one software module in a single layer can be tough; what’s more, debugging multiple interacting modules across all layers is not supported by any debug framework and thus requires patience and many printf trace messages.
To solve this, CoWare developed the Virtual ARM Development Board for Android, which provides an Android-aware debug and analysis framework that enables a deterministic and successive top-down debug approach. The Android awareness is first noticeable by the ability to detect and trace ARM Linux operating system contexts such as interrupt handlers, kernel threads, drivers, and user space processes. The ability to observe process scheduling immediately renders insight into overall system behavior.
As an example, Figure 1 shows an online context trace of a system deadlock after a device resumes from a deep sleep suspend mode. While the device is waking up but not reacting on any keys or touch screen, the system is trapped in a deadlock between a software interrupt (swi) handler and Android’s input device reader process (InputDeviceRead). With this analysis, it becomes obvious that no other important processes such as the window manager are served to handle a key press.
|
|

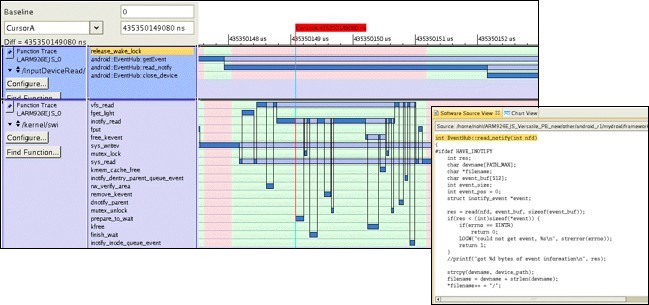
Supporting the top-down debug flow, each process can be further investigated on the function up to the instruction level. Even memory accesses are traced, which allows an effective analysis of behaviors across layers in the software stack.
Figure 2 illustrates the function level interaction between the Android input device reader process and the kernel software interrupt. Identifying which code actually gets executed helps isolate the locations in the large third-party software code base that require the developer’s attention and demonstrates how software interacts across the various layers. In Figure 2, observe how an Android middleware function read_notify triggers the kernel software interrupt swi.
|
|
The analysis solution integrates the logging and tracing capabilities that exist in Android and Linux. Without instrumentation or changes in any parts of the software, the Android logger and kernel debug messages are captured and visualized along with the previously introduced traces. This way, developers can continue to use those facilities with the added value that all logs and traces are synchronized and can be easily correlated with the process and software function, as shown in Figure 3.
|
|

Notice that the Android log is not separated from the important kernel debug messages, and viewing those messages no longer requires working user space applications (such as dmesg or logcat). Traces often need to be accessible when the system is corrupted and the viewer applications or debug bridges are not operating anymore. An example is the early phase of the boot or the transition to and from deep sleep mode. This analysis solution captures the traces directly from the embedded software through the nonintrusive control and inspection capabilities that a virtual platform provides.
The Virtual ARM Development Board and tools complement the existing development environment for Android with powerful system-level analysis tools. The board works with tools such as the Google Eclipse SDK using the Android Debug Bridge. State-of-the-art debuggers such as RealView Debugger (RVD), Lauterbach, or Data Display Debugger (DDD) can carry out embedded software debugging using the board as a target instead of hardware (see Figure 4).
This high level of visibility and the nonintrusive inspection and controllability makes debugging Android a much more streamlined and predictable task.
CoWare 408-392-8500 [email protected] www.coware.com