Four Steps to a Successful Text Analytics Workflow
November 17, 2020
Story

When it comes to an end-to-end text analytics workflow, what do engineers need to know? There are four main phases in the workflow:
Text analytics (the process of uncovering hidden patterns from raw human language to enable better decision-making and predictions) offers several benefits for industrial and predictive maintenance systems. These analytics allow engineers to leverage raw text data to easily generate insights on maintenance records as well as to build failure prediction algorithms to pre-empt potential issues.
Take the off-highway commercial space as an example, where heavy equipment is used on construction sites: If a piece of heavy equipment breaks down, it could become a costly failure between the time and cost required to fix the system and the down time on site while the construction is stalled. Traditionally, telemetry data from this equipment has been used to build predictive maintenance models that can predict future failures. However, there is also valuable information about past failures and their causes in the textual notes from mechanics and operators. Engineers can leverage this text data to augment predictive maintenance models, and to identify patterns and failure modes that should be addressed.
The challenge with text analytics is the sheer volume of unstructured, raw text data sets, which can overwhelm analytics tools. This makes it more difficult for engineers to quickly and intuitively extract all the valuable information that may be available to the user. However, engineers can overcome these hurdles with the right tools and adherence to an end-to-end workflow.
When it comes to an end-to-end text analytics workflow, what do engineers need to know? There are four main phases in the workflow:

Figure 1. End-to-end text analytics workflow. © 1984–2020 The MathWorks, Inc.
Stage 1: Data Access and Exploration
Text data will come from a variety of sources, including databases, internal file repositories, and the Internet, and in a variety of formats. Preparing the data correctly is a crucial factor in a successful workflow. Proper data preparation cleans and preprocesses the raw text data into “cleaned data” for analysis.
Take word clouds for instance. This model translates the data into a format that allows engineers to quickly and easily visualize what words are being used and the most common phrases in the data pool. When combined with engineers applying their domain expertise, visualizations such as word clouds benefit the greater text analytics workflow as engineers can easily spot where the data may be missing the mark or needs to be cleaned more given their knowledge of typical problems or issues within a given environment or use case.
Stage 2: Data Preprocessing
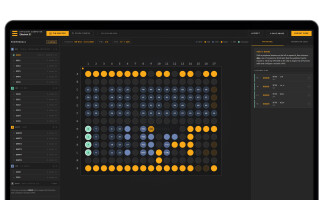
These visualizations also help guide the next actions that need to be taken. As seen in Figure 2, stop words – low-information words that do not add value – are common and their presence skews visualization results. Before engineers can begin the model development process, they must clean the raw text data in order to filter out these “stop words” and enter the true, important data to pass along for the modeling process. The preprocessing phase allows users to extract meaningful words from the raw text.
Data cleaning is often the most time-consuming part of data analytics, and depending on the volume of data, the cleaning step may take several iterations. However, the ROI that stems from putting in the additional time and resources required allows for a more accurate and successful model later in the text analytics workflow. In many cases, a clean word cloud relays more information about what is actually on a page of text.

Figure 2. Preprocessing the data. © 1984–2020 The MathWorks, Inc.
Tools such as Text Analytics Toolbox support engineers with the data cleaning pain point by helping users prepare for the model building process by providing algorithms and visualizations for preprocessing, analyzing, and modeling text data.
These tools extract text from popular file formats, preprocess raw text from sources such as equipment logs, news feeds, surveys, operator reports, and social media, extract individual words or multiword phrases (n-grams) that take advantage of textual, numeric and other types of data, convert text into numerical representations, and then build statistical models.
Stage 3: Predictive Model Building
Once the data is cleaned and pre-processed, it’s time to begin building the predictive model using either machine or deep learning algorithms.
Here is where the advantage of text analytics kicks in: It finds hidden patterns in the data and displays them in an intuitive format that allows users to digest the data and then take corrective actions to resolve the issues before moving further in the workflow.
Take putting clean text data into numeric form as an example. Engineers can apply a modeling approach like “bag-of-words,” which creates a numeric matrix from the text data supplied, showing each word’s usage frequency. From there, engineers can then use predictive models like the latent Dirichlet allocation (LDA) model, which can be fitted to a word/frequency matrix to uncover hidden topics and insights in the text dataset.
As seen in Figure 3, the LDA model can produce word clouds associated with “hidden topics” in the data, showing how patterns begin to emerge from fitting the text data into this predictive model, helping inform creating a solution to a respective problem.
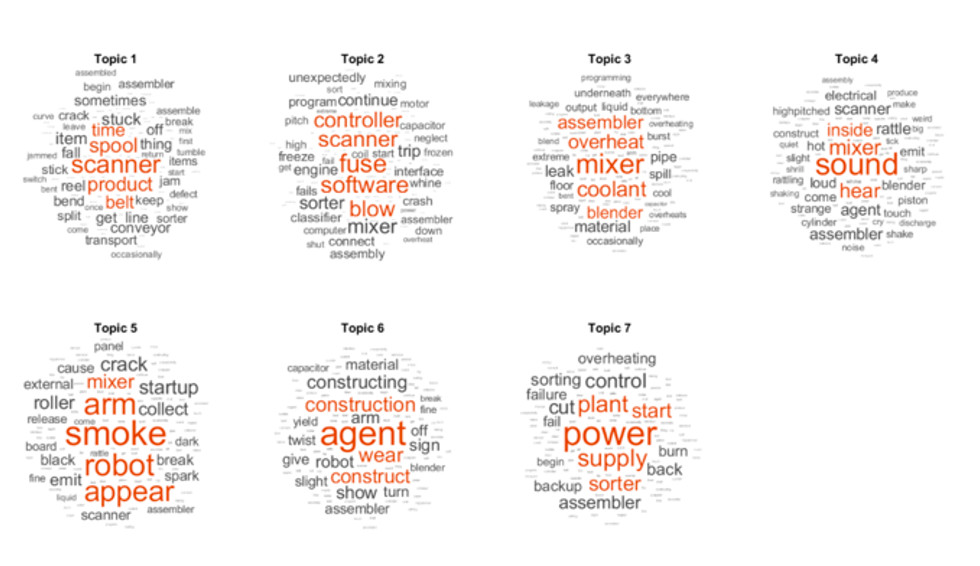
Figure 3. Automatic identification of topics in factory report data using the LDA method. Topic 2 is related to issues with electronics. Topic 3 is related to issues with the fluid system. © 1984–2020 The MathWorks, Inc.
Once the models, such as the one in the above example, are tested with a new narrative to verify that the model’s prediction is correct, automatic alerts can be established so that the system sends flags to the response team on any issues that need attention. If location data is also available, the results find a correlation between certain topics (e.g., a flagged issue) and its location data, so the model can also alert response teams to potential larger issues with infrastructure by using multiple data streams to supplement text data.
Stage 4: Insights and Predictive Model Deployment
Once the model is set up using text analytics and has been validated for acceptable performance, there are several ways to share the results and models with engineering teams and/or management, including generating reports or interactive notebooks (e.g., MATLAB Live Editor), communicating the data to desktop or web applications (e.g., MATLAB App Designer), or hosting the application on a production server or web app server.
For engineers in industries such as industrial automation, machinery, automotive manufacturing, aerospace design, or energy distribution, text analytics can help them perform sophisticated numerical analysis to identify groups of ideas and concepts that can lead to better outcomes and improve functions like predictive maintenance.